How we report our progress says a lot.
Sometimes we focus on actual values (size):
We made a net profit of $15m
We manufactured 25,000 widgets this quarter
Sometimes we focus on the first derivative (growth):
Revenue increased 9% compared to last year
We hired 18 new team members
On rare occasions we can focus on the second derivative (acceleration):
We added 100,000 new customers in the last year, 70,000 of these in the last quarter
The number of medals won has increased at each of the last three Olympics
There is a time and a place for each of these types of measures. But the choice we make often depends on the narrative. The temptation to hide is most obvious when one or two of the measurements are unflattering. For example, when we’ve stopped accelerating and don’t really want the headline to be “growth slows” or where we’ve stopped growing and prefer to focus on how big we got. To see the full picture we need all three measures.
The ideal for any early-stage startup is the sweet spot where everything is positive: good numbers, growing fast and accelerating over time. Often, and incorrectly, startups refer to this phenomenon as exponential growth, or “hockey stick” growth.1 This name makes much more sense once you realise that the expression originated in North America where “hockey” means “ice hockey” not “field hockey” – the stick makes a very different shape when projected onto a graph.
I’ve seen that terminology mislead a number of people who are working on new things over the years. They hear it and mistakenly think that growth is either a hockey stick or a pool cue, and that it’s impossible to tell one from the other until the very last moment. So they flail away, with numbers that are not growing let alone accelerating, and hope that the inevitable uptick is just around the corner. They imagine that if they can just keep going then one magic day their results will flip from being terrible to amazing.
When we look closer at those things that have grown to become very large, like Trade Me and Xero, that is not typically what happens at all. It’s true that those ventures described as an “overnight success” often take many years to get to that point. The mistake is thinking that they are not growing from the beginning.
Up and to the right
Some examples…
Shortly after Trade Me was sold to Fairfax in 2006, I spoke at the first ever Webstock, a conference that in subsequent years became an important event for the New Zealand tech community. It was one of the first opportunities I’d had to talk in public about the inner workings of Trade Me, and I was anxious to make the most of it. “How did Trade Me get so big?” asked one of my slide. The answer: “One member at a time.”
I offered two graphs to demonstrate the growth in new listings on the site over time. The first showed the results from the first two years of operations. It had taken a few months to get started then the number of listings accelerated from there. By the end of 2001 we were often adding more than 2,000 new listings per day.
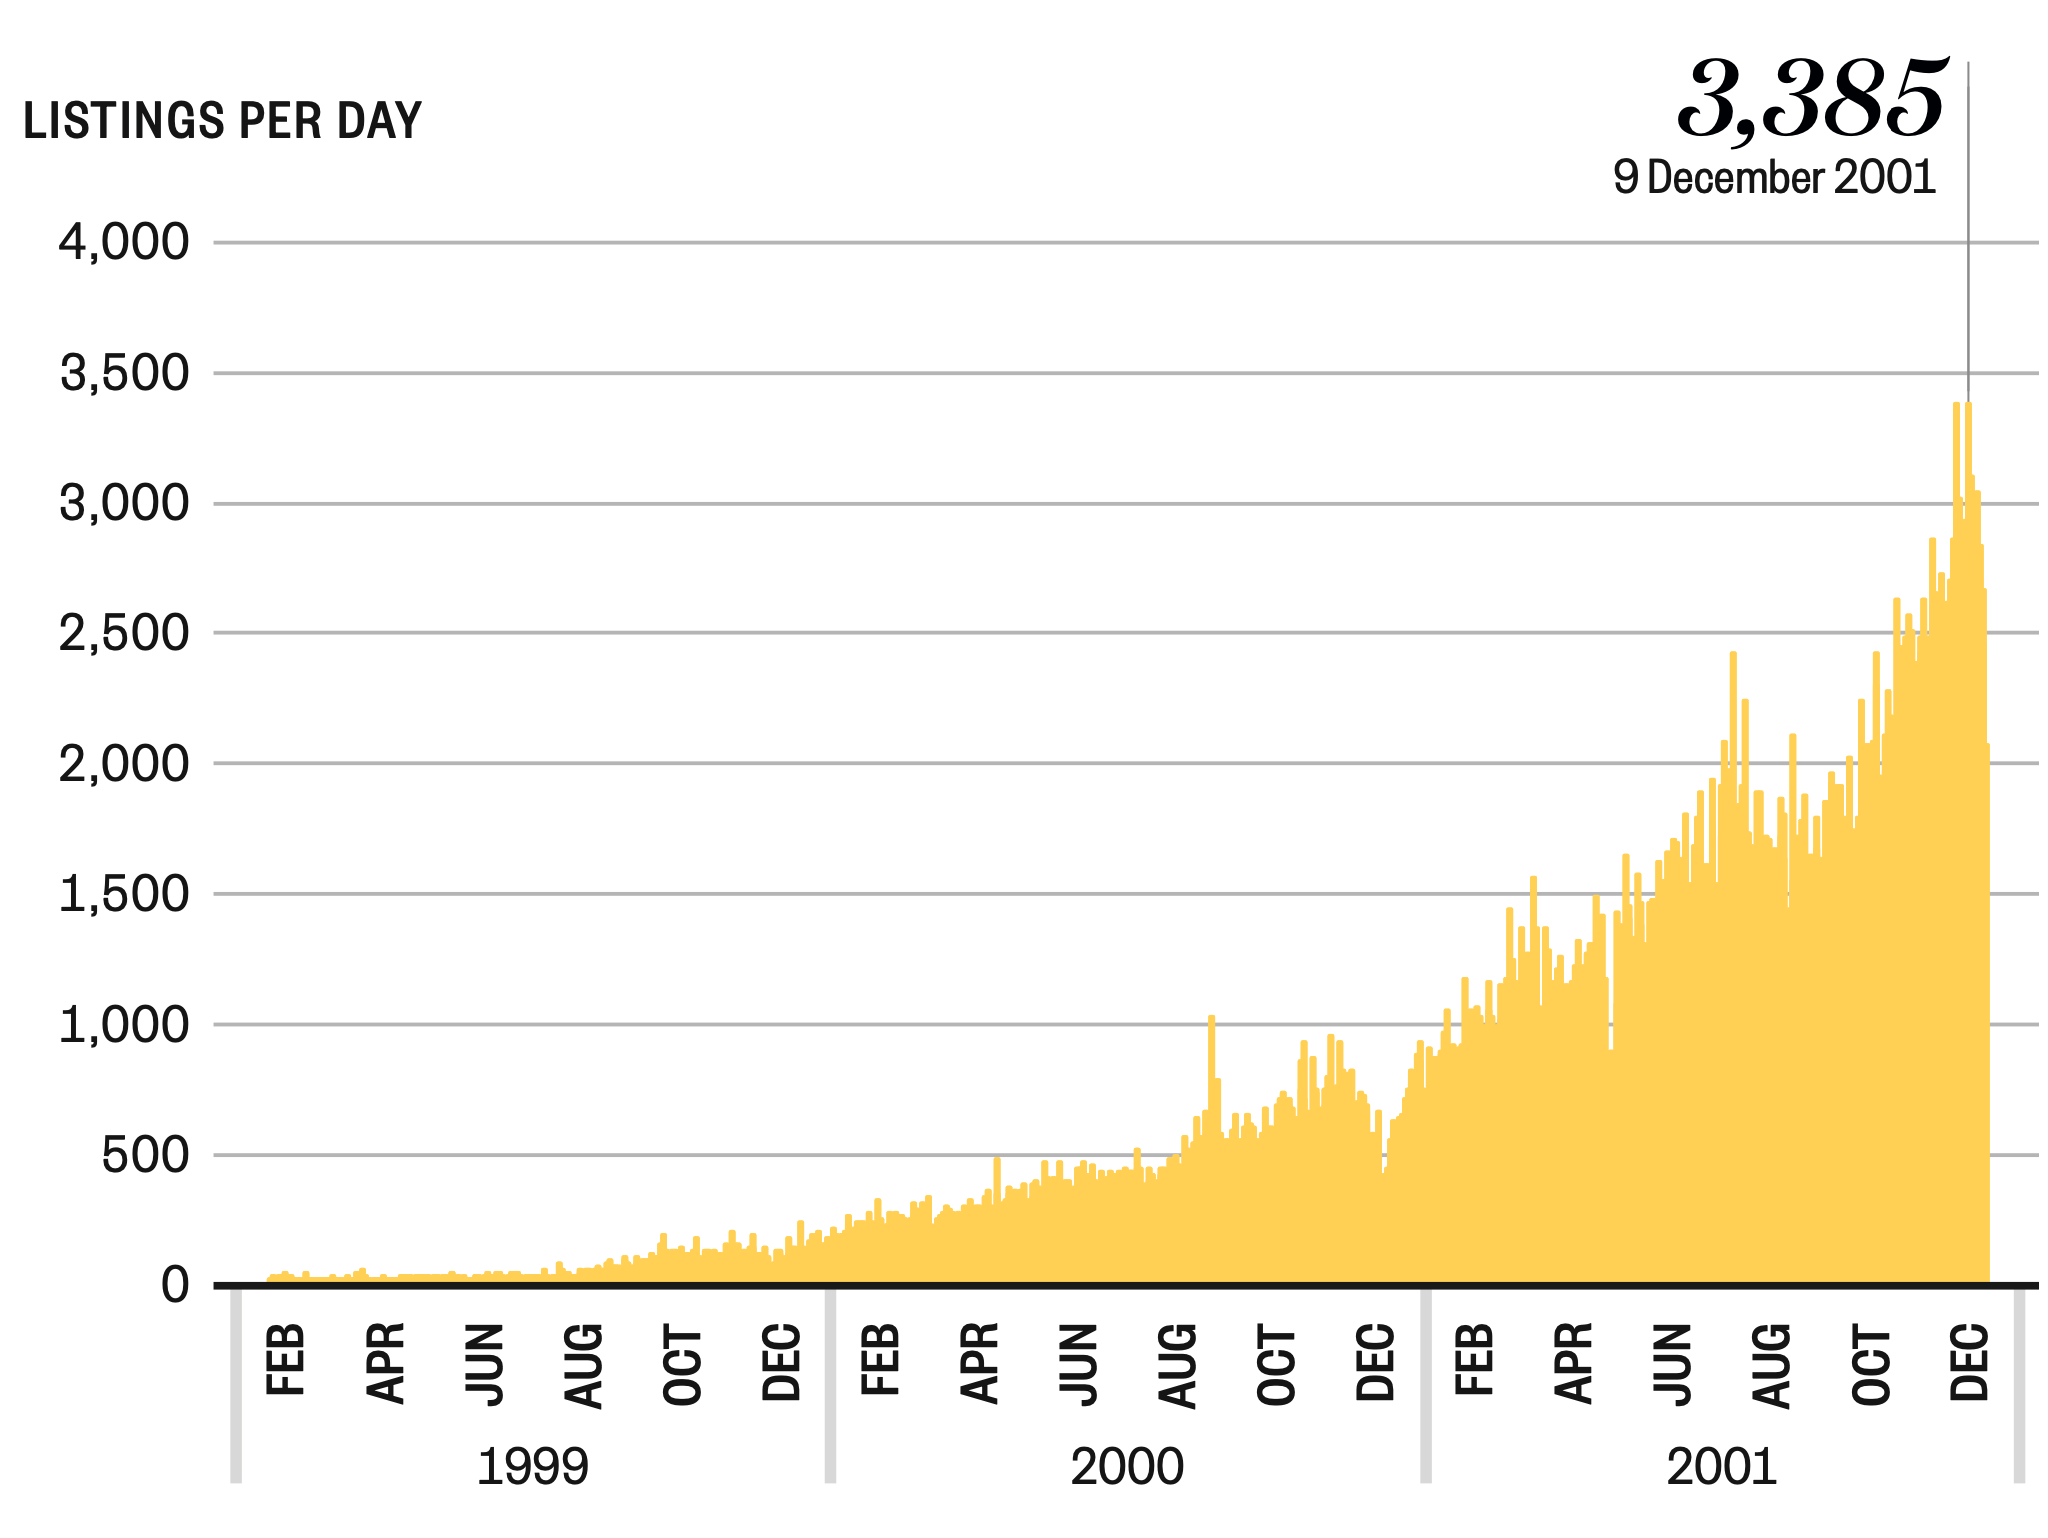
The second graph showed the full stretch of seven years up to when I was speaking. The bracketed area labelled “A” is the data from the first graph. By the time the business was sold in 2006 there were more than 100,000 new listings placed on the site every day – a 50-fold increase.
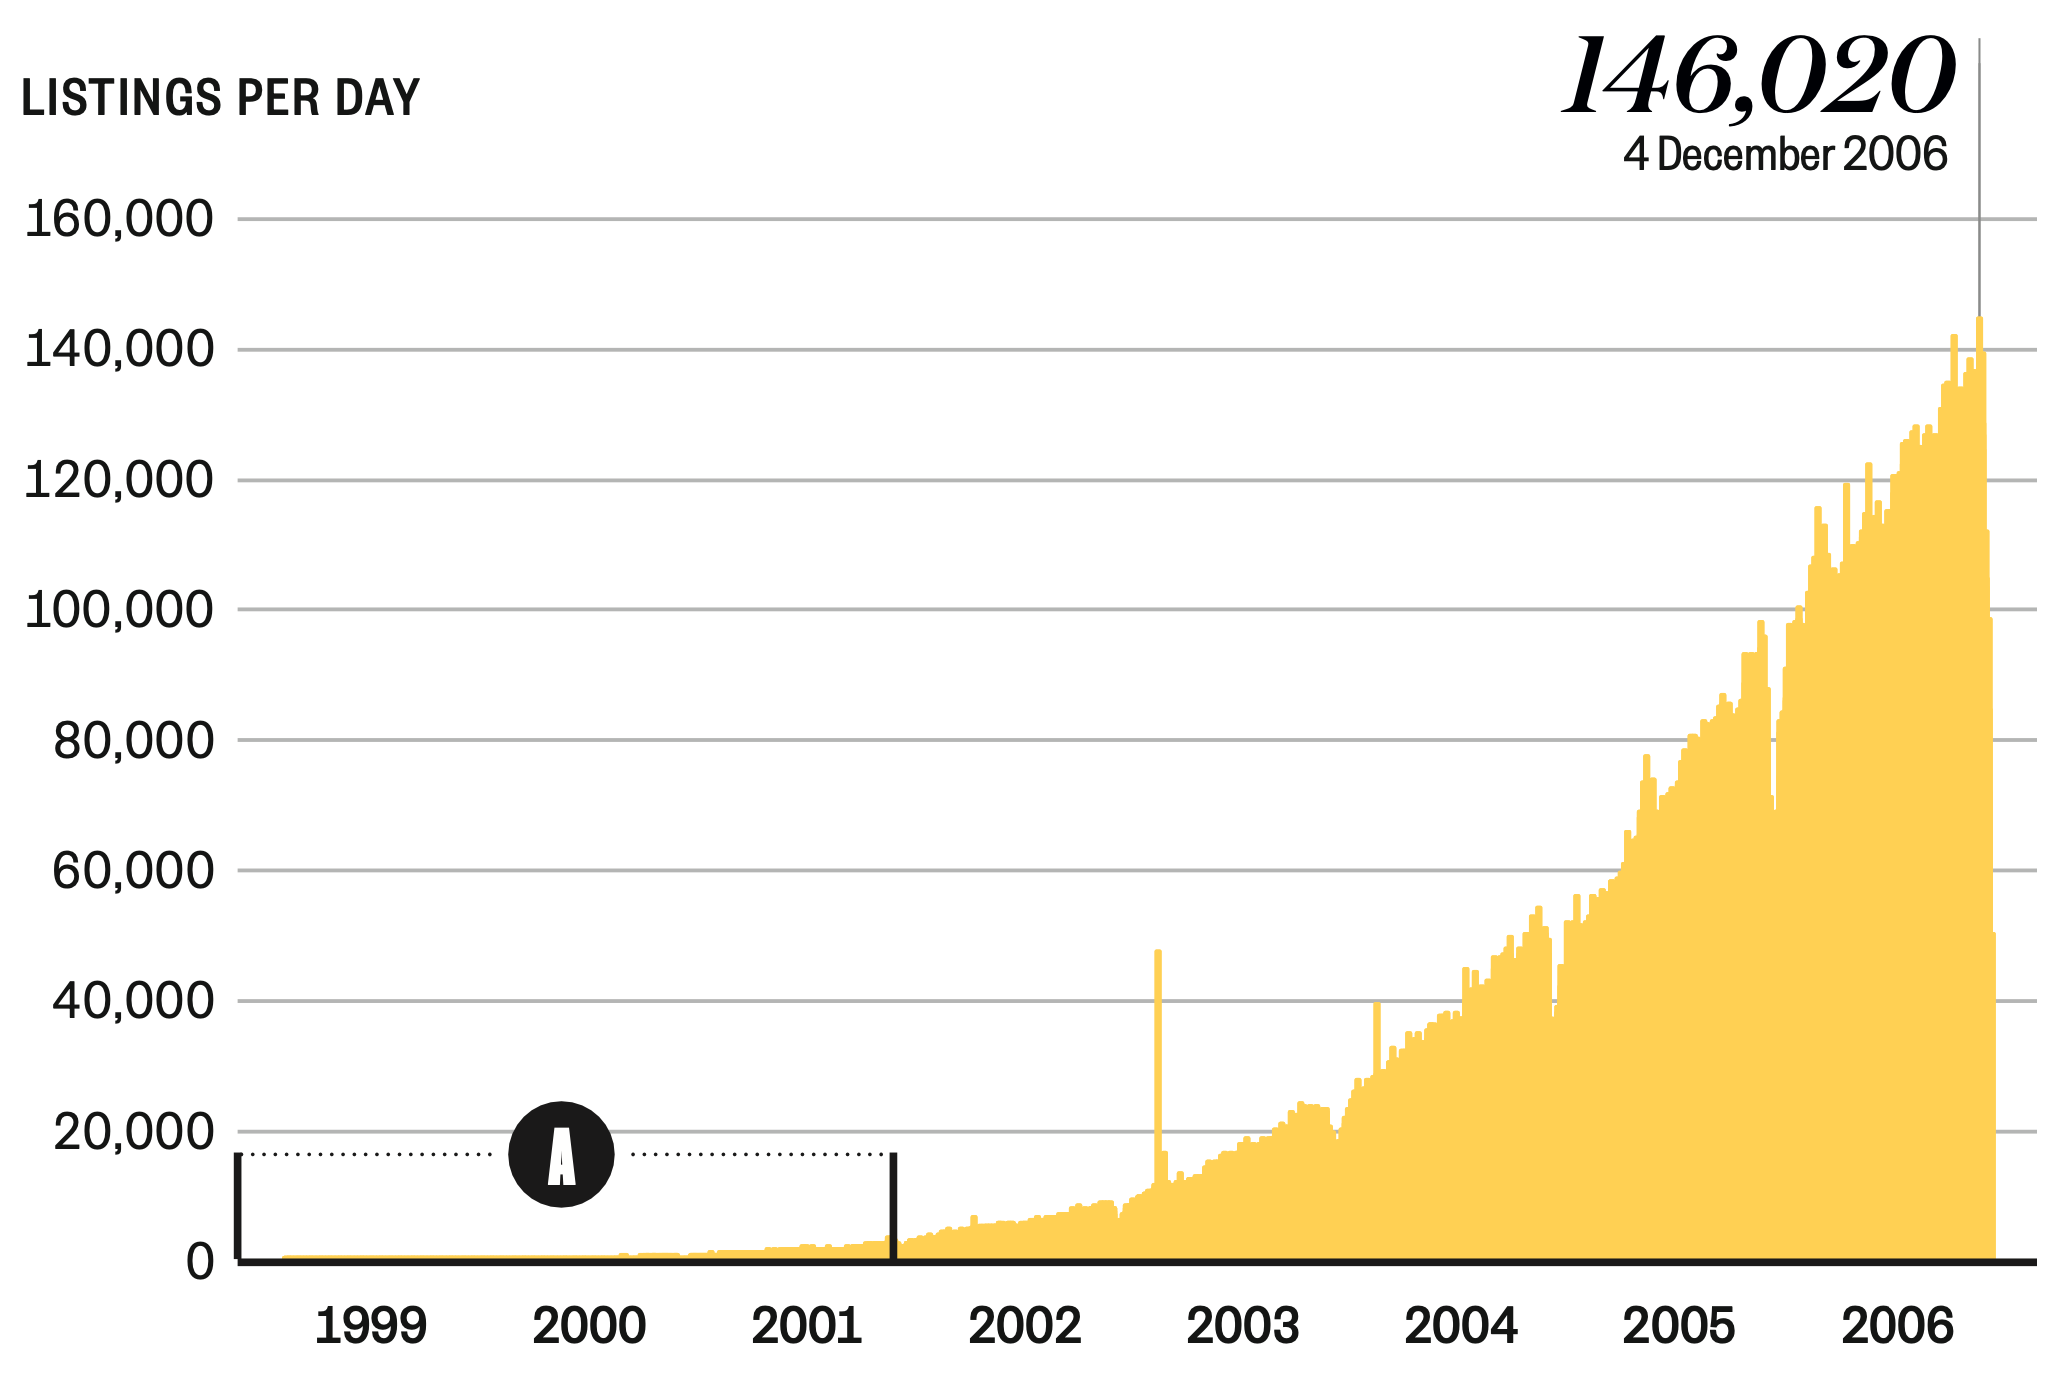
(The big dips each year are Christmas, when people took a break from the internet to spend time with family and friends. Happily for us, anybody who was already addicted spent the break raving about Trade Me and helping to fuel a spike in growth every January!)
These two graphs have the same familiar shape. The numbers in the first graph are much smaller, and when we look at that same time period retrospectively it looks flat, because the vertical axis is so much taller, but when we zoom in – or, more importantly, when we are living in that moment – it’s not flat at all.
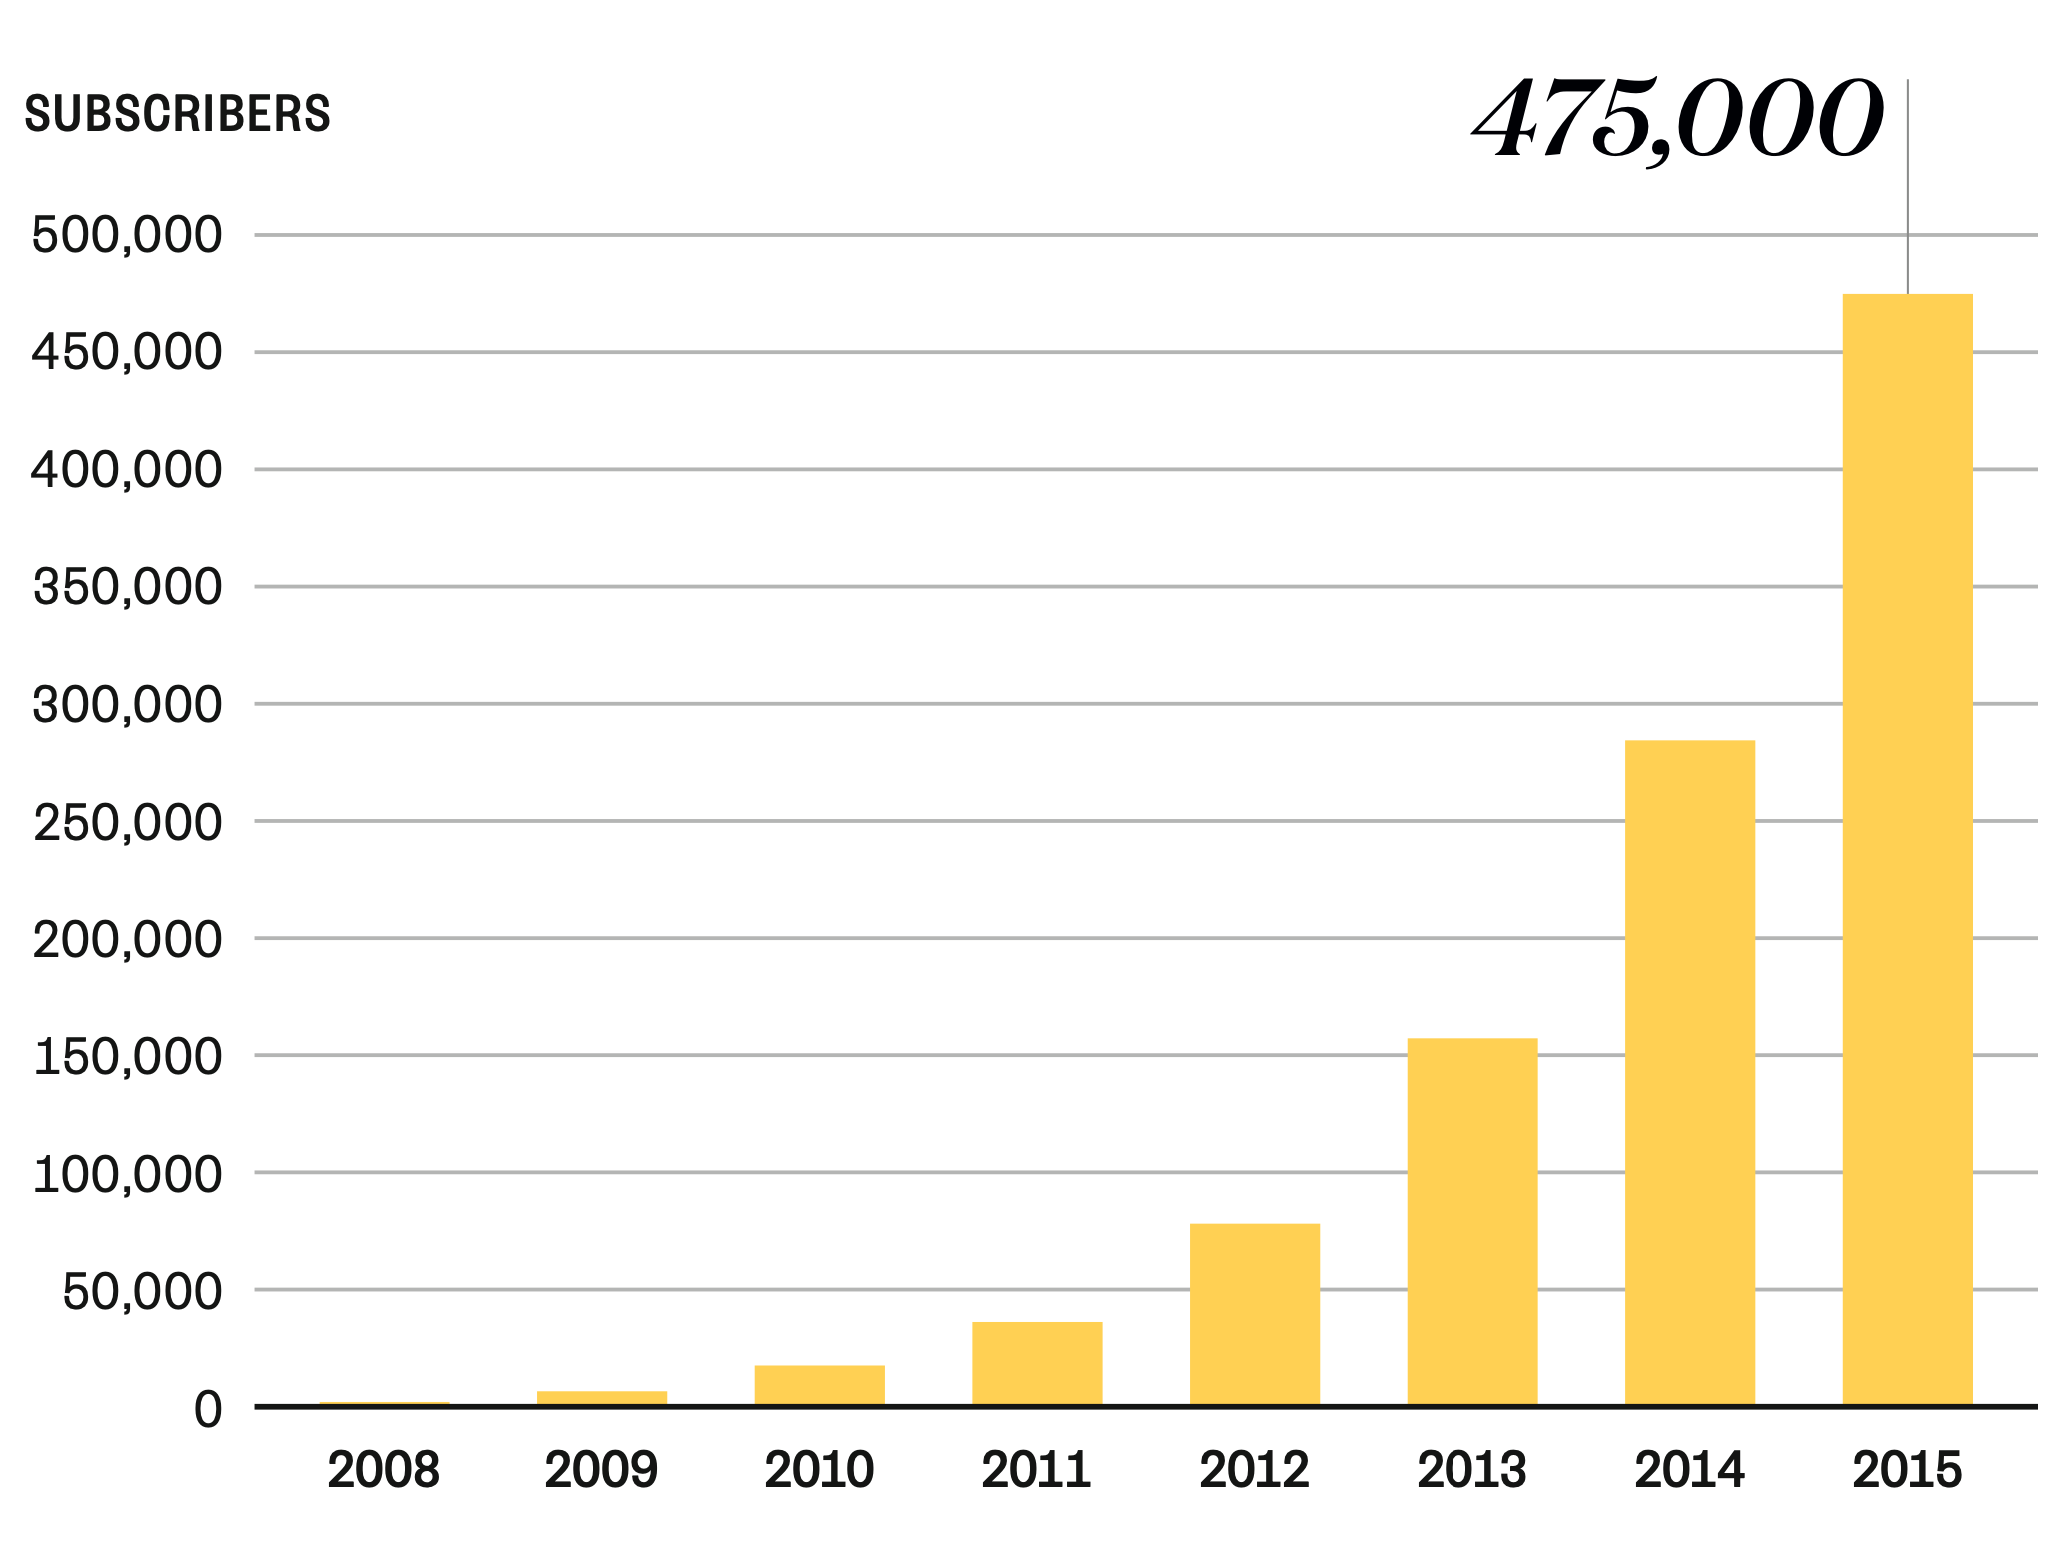
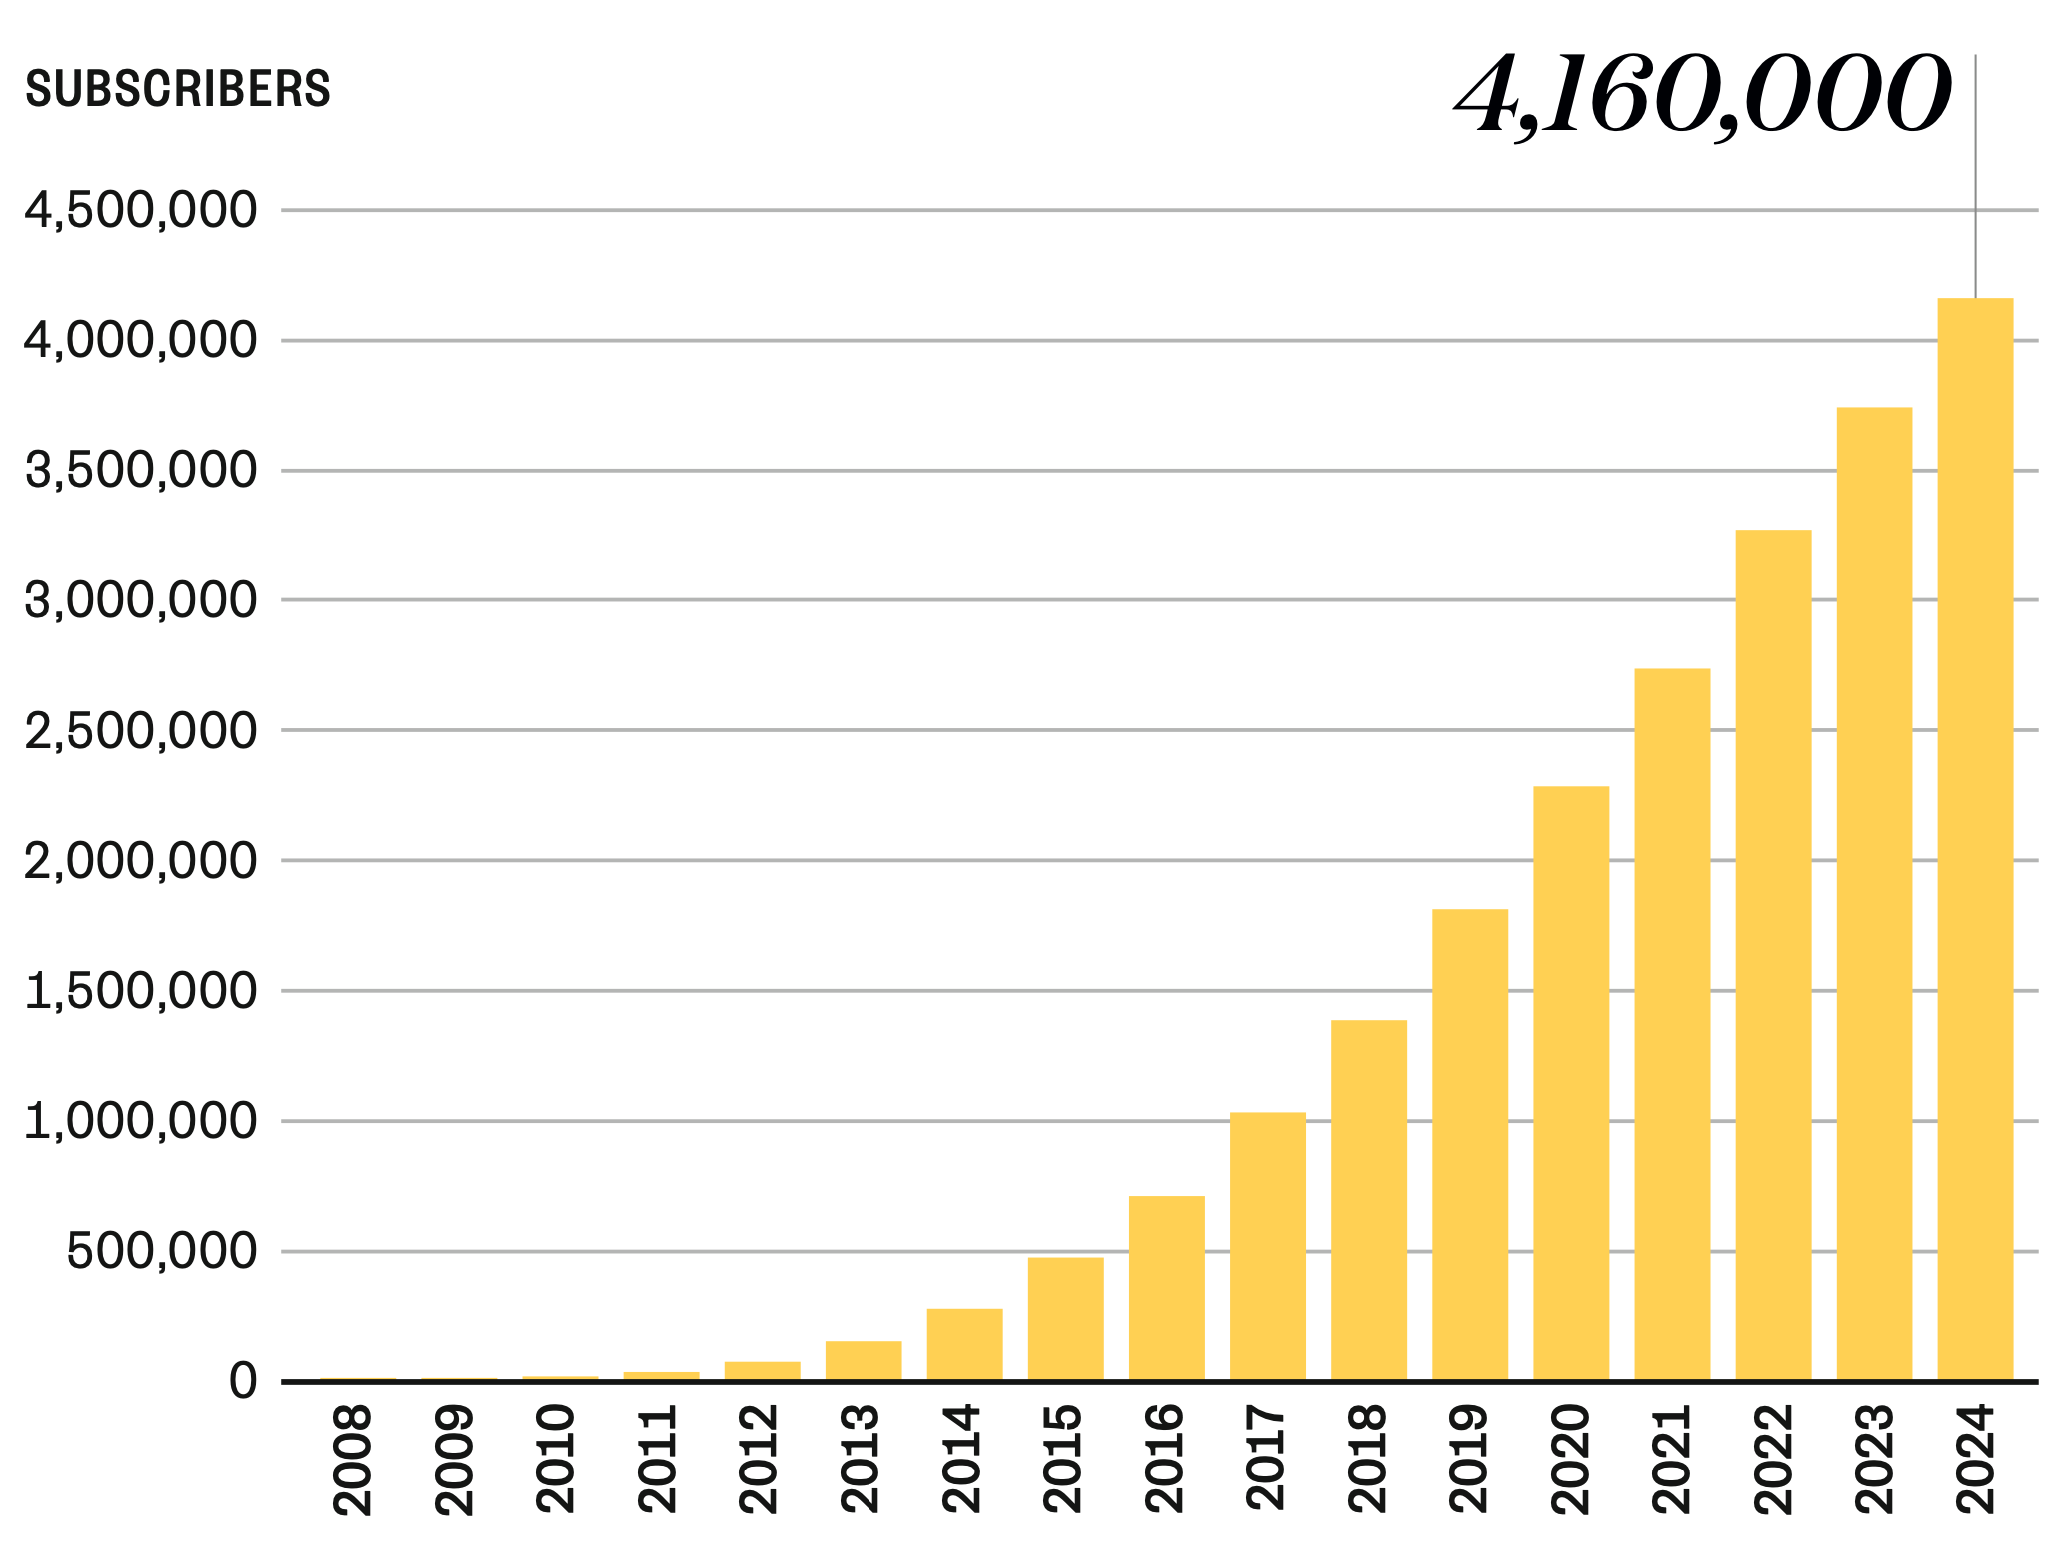
The same is true of Xero’s subscriber base. When we plot this over different time periods we see a very similar pattern. The growth in the first eight years looks amazing – from 950 subscribers in 2008 to 78,000 in 2012, and then continuing to accelerate to more than 475,000 in 2015.
When we zoom out to a wider scale and include the growth that has happened since then – by now those early years look like rounding errors.
When we zoom out an include the growth that has happened since then … by now those early years are nearly rounding errors.
Again, the numbers in the beginning are small, so growth looks modest in retrospect, but are really meaningful in real-time – growing from 950 to 6,000 subscribers in the second year, and nearly tripling again the following year, to 17,000. And just like the Trade Me results, the shape of the growth is similar, no matter what time period we are looking at.
There are a couple of lessons here. First, when we’re working on something that needs to grow in order to be successful then it’s really important to have some measure that is growing right away. It doesn’t matter what, especially at the very beginning. But if all of our numbers are flat then, let’s face it, we’re not on a growth path. Ideally we can identify one thing to focus on that is connected to the success of our business model – like the number of unique sellers at Trade Me, or the number of connected bank accounts at Xero. Once we pay attention to something specific, it highlights what is currently constraining our progress in that area and helps us identify the things we can do to improve that number.
Secondly, and even more importantly, we need to be patient. Even companies that eventually achieve remarkable growth start off with relatively modest numbers. But they constantly grow, and compound that growth. While it’s great to dream big, consistency wins in the end. So we should understand where we need to be next year, next month and next week in order to still be on track. Then, when we get there, we can smile benignly when others describe our venture as an overnight success.
-
As Tim O’Reilly once pointed out: what we assume to be exponential growth is nearly always sigmoidal, given enough time, and sinusoidal, given even more. ↩︎
Related Essays
How to Scale
What a founder in one of the poorest areas in Kenya taught me about how to start and how to scale
Unit of Progress
Be specific: Where are we going and what will it take to get there?
Break Points
We don’t always prepare for growth that happens suddenly, in bursts.
Buy the book